Labs
Tools and visualizations built on UN Comtrade data by other organizations and researchers. They are run by their authors, not by the United Nations, and their descriptions are in English.
Tools
19 tools
-

HS Tracker (opens in a new tab)
The HS Tracker is a toolset that has been developed by the Secretariat of the World Trade Organization (WTO), with the support of the World Customs Organization (WCO), to allow different stakeholders (e.g. customs and trade officials, statisticians, lawyers, researchers, etc.) to track the changes of particular headings or subheadings across different versions of Harmonized Commodity Description and Coding System (HS).
-

The SCN Global Flow Monitor (opens in a new tab)
The SCN Global Flow Monitor is an interactive stress-testing simulator of the global crude oil trade network, built on UN Comtrade 2025 reported flows (HS 2709). Users select a chokepoint or exporter, set the severity and duration of a disruption, and watch the shock propagate country by country: flow losses, endogenous market prices, and strategic reserve drawdowns unfold on a 3D globe over a configurable horizon. The tool contrasts a fixed-topology model against one where countries rationally rebalance their trade relations under price feedback, illustrating how decentralized reactions can amplify a local disruption into a systemic one. The underlying mathematical model is described in a companion working paper (arXiv:2607.17491).
-

Trade in a Bottle (opens in a new tab)
Trade in a Bottle identifies extreme import bottlenecks in international trade - relations in which a single partner country supplies a dominant share of another country's imports of a given product, above a meaningful trade-value threshold. Built on UN Comtrade bilateral trade data and operating across multiple levels of the Harmonized System, the application offers three interactive views: a global summary of bottleneck counts per country, detailed bottleneck records for any selected economy, and a parametric matrix that lets users adjust the share and value thresholds on the fly. Trade in a Bottle helps researchers, analysts, and policymakers move beyond aggregate concentration measures and pinpoint the specific country–product–supplier relations that constitute single points of failure in global supply chains.
-

Trade Section of the Crop Observatories Alliance (opens in a new tab)
This tool provides interactive visualizations and calculated indicators on international trade for key crops — cassava, beans, bananas and plantains, and rice. It displays time series data on import and export volumes and values, complemented with country-level information on trade destinations and origins. The tool enhances trade analysis by offering derived metrics to support evidence-based decision-making in agriculture, research, and policy. Additional sections of the observatories provide complementary insights on production, consumption, prices, and other key dimensions of each crop system.
-

World Trade Comparative Advantage Lab (WoTCA) (opens in a new tab)
A data visualization tool that helps users identify countries' comparative advantages based on historical world trade data.
-

Spiceflow – Visualizing Global Trade Like Never Before (opens in a new tab)
Spiceflow transforms complex global trade data into intuitive, interactive visualizations. By interpreting trade as a network, the app reveals the deep interconnections between nations, suppliers, and buyers. With Spiceflow, users can instantly grasp the movement of commodities across borders through dynamic flowcharts—because a picture truly is worth a thousand words. Trade flows can be filtered by region (e.g., Africa) or economic organizations (e.g., NAFTA, EU, BRICS), making it easy to focus on specific trade relationships. Additionally, historical trends allow users to analyze changes in global trade over time.
-
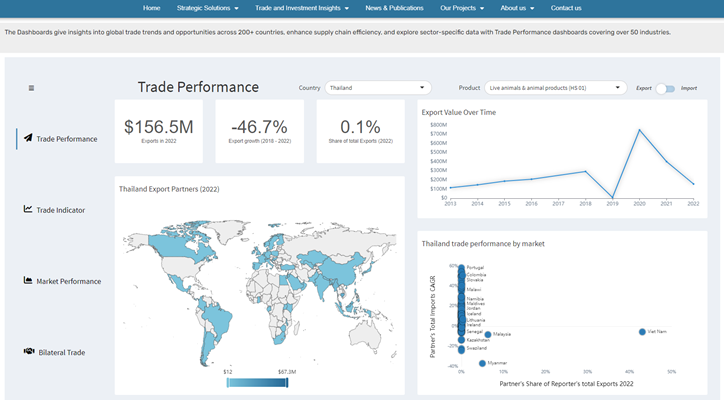
Trade Performance Dashboard (opens in a new tab)
Get access to trade data for more than 200 countries and discover patterns and trading opportunities through our Trade Performance dashboards. Our dashboards allow users to explore the evolution of more than 50 different sectors worldwide. The Trade Performance dashboards allow users to explore country-specific trade data, enabling them to analyse trade performance, and logistics, as well as bilateral imports and exports, providing the users with a deeper understanding of their key markets.
-

Trade data Platform for the Arab Region (opens in a new tab)
The UN Economic and Social Commission for Western Asia presents interactive external trade platform of the Arab countries in English and Arabic. The platform's main tool, the trade database, provides standardized time-series trade data for the 22 Arab countries with customised visualizations that foremost capture the intraregional trends as well as the region’s trade performance with the rest of the world. Trade data are compiled and presented in the most detailed products level at HS-6 digits. Search facility allows finding exports and imports of the Arab countries data for the years 2012 - 2020 by product or HS code and can be displayed by economic groupings and product categories. Data updates are processed on quarterly basis.
-

Climate Change Indicators Dashboard (opens in a new tab)
Explore our new Climate Change Indicators Dashboard, a one-stop shop for climate and economic data. Designed with data from international organizations, the dashboard aims to become a comprehensive aggregator for statistical indicators on climate change, greenhouse gas emissions from economic activity, trade in environmental goods, green finance, government policies, and physical and transition risks. Trade in environmental goods indicators are derived from detailed commodity data from Comtrade.
-

Trade Data Analytics and Visualization (opens in a new tab)
TrendEconomy (TE) open data portal is based on Statistical Data and Metadata eXchange (SDMX) standard and contains up-to-date yearly and monthly international merchandise trade data from UN Comtrade with a number of visualizations and analytical tools. TE offers users the ability to easy find and select information that is needed. Five different types of data visualization are available: scalable map, configurable pivot table, line, column or pie chart. Portal has a user-friendly and intuitive interface with the ability to download data as an image or as a table.
-

The Atlas of Economic Complexity 2.3 (opens in a new tab)
The Center for International Development at Harvard University has launched version 2.3 of The Atlas of Economic Complexity. This updated version provides new data including trade in services for over 170 countries and trade in more than 5000 new goods worldwide. The Atlas is a powerful research and data visualization tool that allows people to explore over 50 years of trade dynamics for every country. The tool combines raw COMTRADE and IMF data with insights from CID's research in a way that is accessible and interactive. Today, The Atlas is used by policymakers, investors, entrepreneurs and academics as an important resource for understanding a country's economic structure
-

NAFTA Trade Flows (opens in a new tab)
Which commodities have experienced the greatest increase in trade within NAFTA? Which NAFTA countries have the strongest import-export bonds between each other, and at what point in time? How much intra-NAFTA trade occurs compared to extra-NAFTA trade for a given commodity? Thomson Reuters Labs collected, analyzed and visualized UN Comtrade data to find out.
-

NYU Stern Globalization Explorer (opens in a new tab)
The NYU Stern Globalization Explorer is a tool to help support informed decision-making about globalization in business and public policy by providing the academic world’s most comprehensive set of content on the flows that connect countries. It is a project of the DHL Initiative on Globalization at the NYU Stern Center for the Future of Management. The maps tool shows what the world looks like from the perspective of different economies by sizing and coloring countries according to indicators of international activity. It can help debunk common myths and inform strategic thinking. The CAGE Comparator applies Pankaj Ghemawat’s CAGE Distance Framework to analyze how cultural, administrative, geographic, and economic distances shape international activity.
-
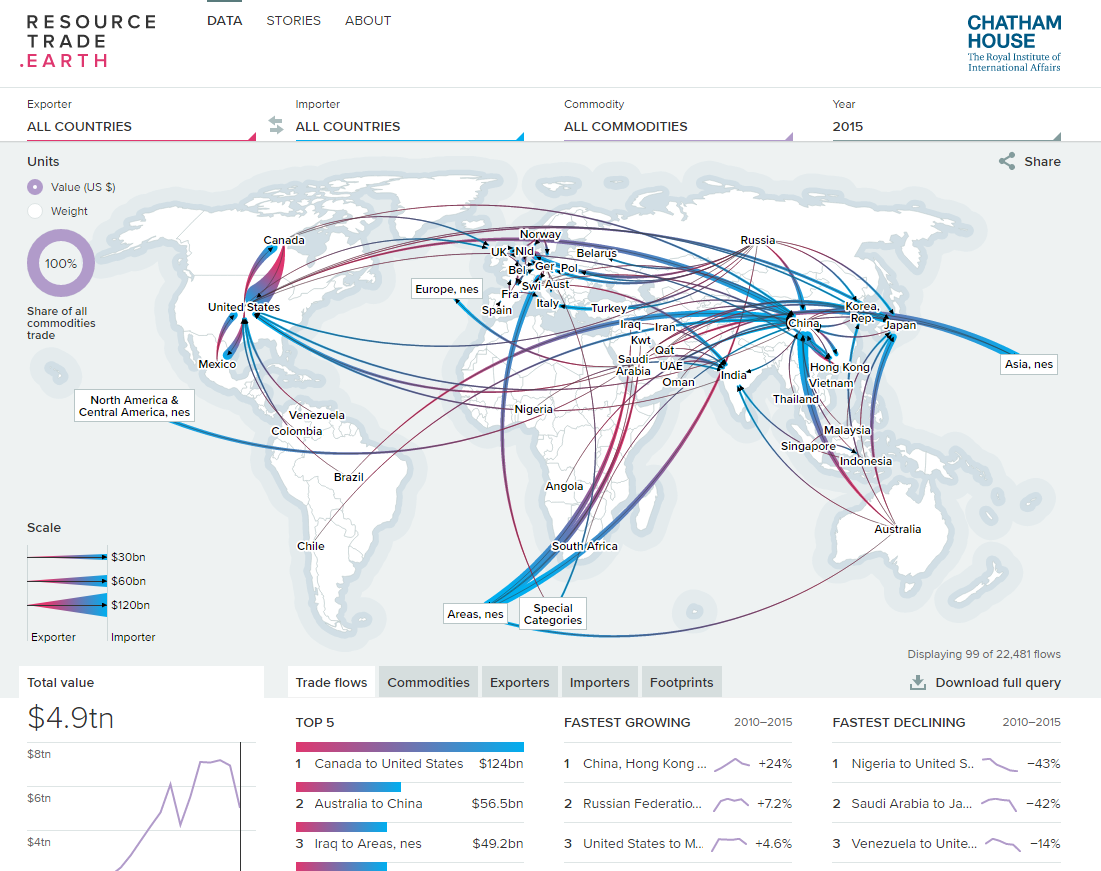
ResourceTrade.earth (opens in a new tab)
resourcetrade.earth has been developed by Chatham House to enable users to explore the fast-evolving dynamics of international trade in natural resources, the sustainability implications of such trade, and the related interdependencies that emerge between importing and exporting countries and regions.
-

Trade Map (opens in a new tab)
Trade Map provides - in the form of graphs, maps and tables - indicators on export performance, international demand, alternative markets and competitive markets, as well as a directory of importing and exporting companies. The monthly, quarterly and yearly trade flows are available from the most aggregated level to the tariff line level.
-

Asia Pacific Energy Portal (opens in a new tab)
The Asia Pacific Energy Portal provides interactice visualization of energy-related data and policy information for ESCAP member and associate member States, including information on pricing, international trade, investment, environment, access and related policies. It also provides maps and Sankey diagrams of energy imports and exports based through UN Comtrade Public Data API.
-

The Globe of Economic Complexity (opens in a new tab)
The Globe of Economic Complexity dynamically maps all countries' traded commodities, their volumes and export destinations, and allows users to navigate export networks and intricate connections between products. The tool utilizes novel web technologies (WebGL) and design to visualize trade flows as 3-d "confetti," with the ability to morph into bar charts, compounded country textures, and node-link diagrams.
-
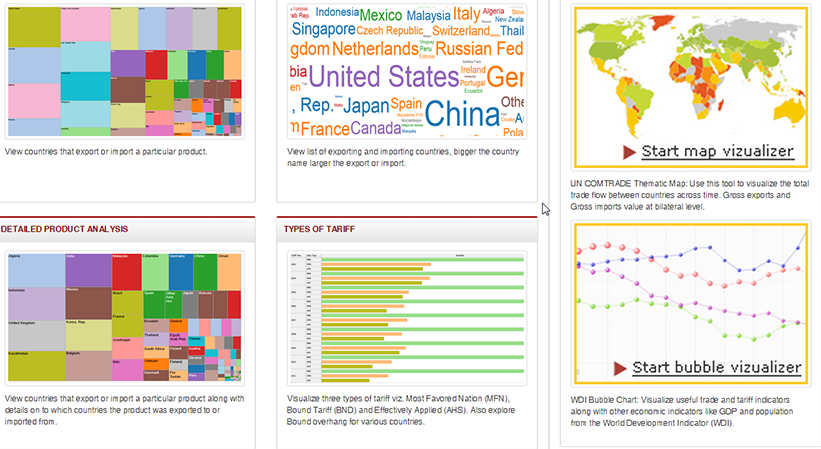
Trade Data Visualization (opens in a new tab)
World Integrated Trade Solution (WITS) provides both simple and detailed visualizations analysing country, product and tariff trade flows. WITS also offers an additional visualization, "Openness to Trade", which presents the relationship between trade openness and economic growth.
-

Global Economic Dynamics (opens in a new tab)
The "Global Economic Dynamics" (GED) project of the Bertelsmann Foundation is intended to contribute to better understanding of the growing complexity of global economic developments. By using the latest tools and methods for measuring, forecasting and modeling global economic dynamics, the project is designed to make globalization, its economic effects and its political consequences more transparent and understandable